This function allows you to add the Exploristics theme to a ggplot2 figure.
Usage
exploristics_theme(
  base_size = 12,
  base_family = "",
  base_line_size = base_size/11,
  base_rect_size = base_size/11
)Details
This function is added to your ggplot to set elements of the `theme()`
including background, axis, legend and titles to the style used at Exploristics.
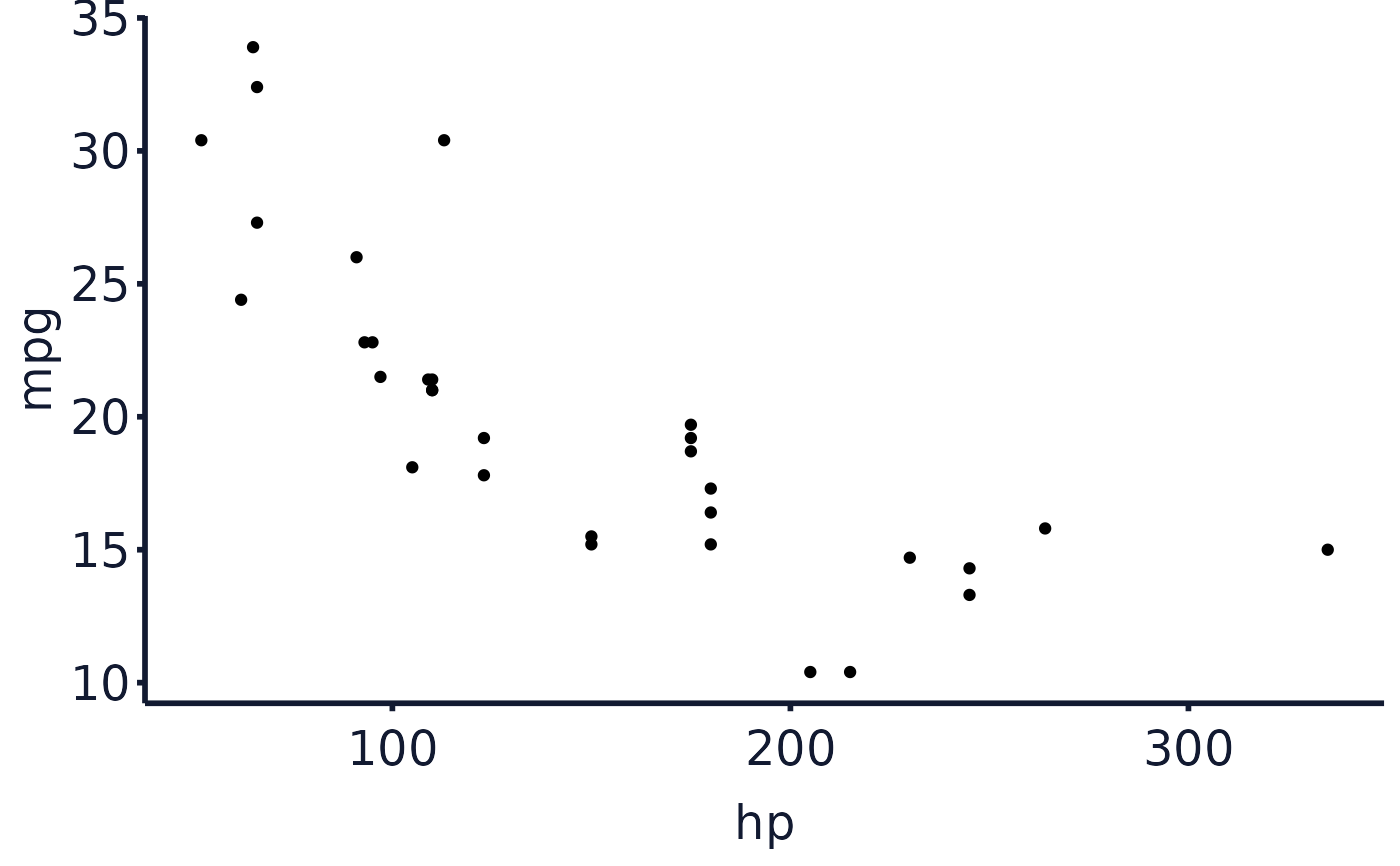
Examples
library(ggplot2)

## generate a plot and add the Exploristics theme
ggplot(data = mtcars, aes(x = hp, y = mpg)) +
geom_point() +
exploristics_theme()