This function returns a ggplot with an Exploristics colour scheme added to it. There are 3 colour palettes to choose from RGB, a darker RGB and Mono.
Details
This function sets the colour of the ggplot to a palette matching an Exploristics colour scheme. A gradient of the palette will be applied for continuous variables.
Expl_RGBis a palette of 6 colours including blues, reds, green and yellow.Expl_RGB_darkis a palette of darker shades of the 6 colours withinExpl_RGB.Expl_Monois a palette of 6 colours ranging from a dark navy through grey to white.
Examples
library(ggplot2)
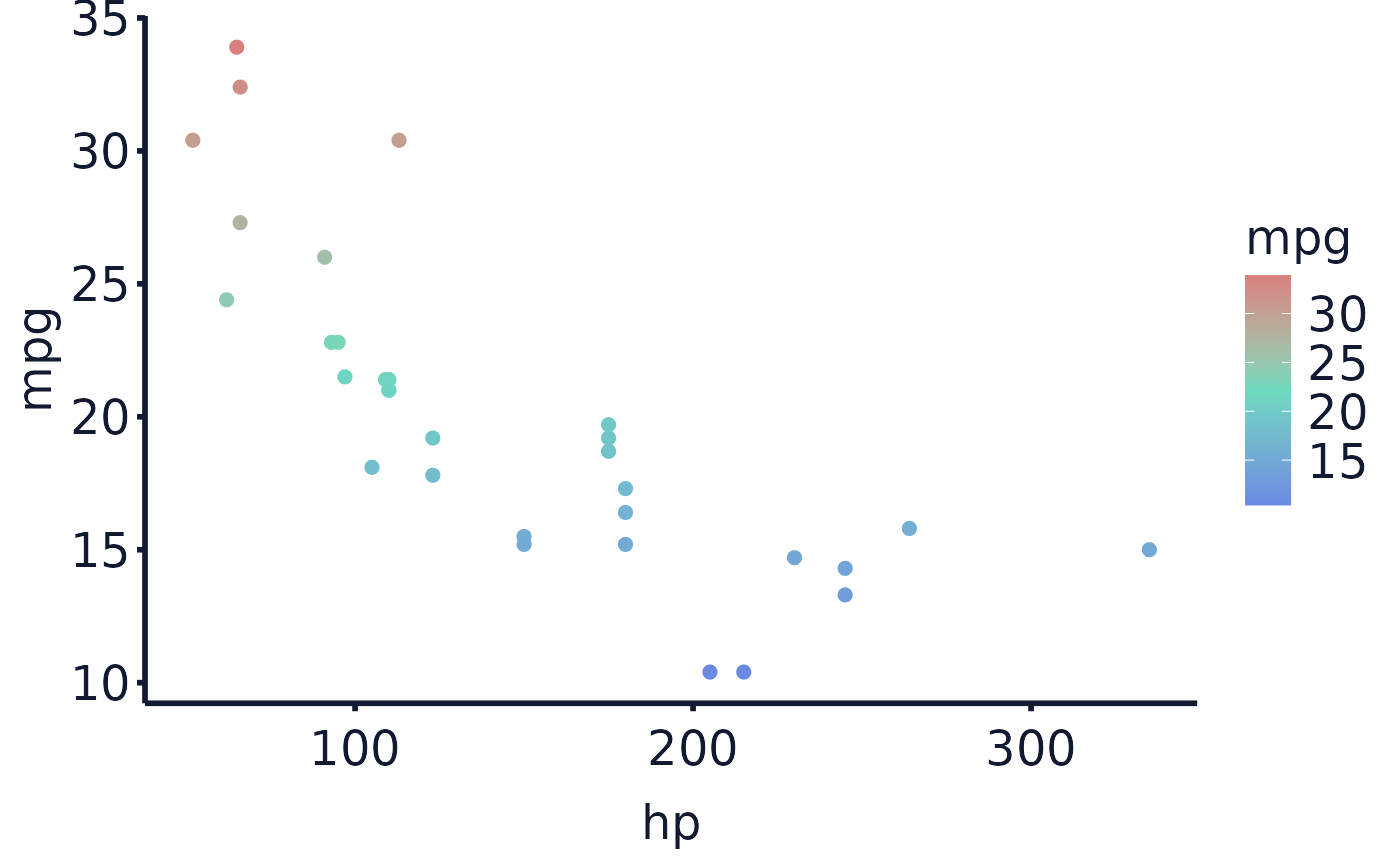
## generate a plot with the Exploristics theme
cars_plot <- ggplot(data = mtcars, aes(x = hp, y = mpg, colour = mpg)) +
geom_point(size=2) +
exploristics_theme()
## adding the colour scheme can be written as one line
exploristics_colour(cars_plot, colour_pal="Expl_RGB")
 library(magrittr)
## or using a pipe
cars_plot %>%
exploristics_colour(colour_pal="Expl_RGB")
library(magrittr)
## or using a pipe
cars_plot %>%
exploristics_colour(colour_pal="Expl_RGB")