This function returns a ggplot with an Exploristics colour scheme added to it. There are 3 colour palettes to choose from RGB, a darker RGB and Mono.
Details
This function sets the fill of the ggplot to a palette matching an Exploristics colour scheme. A gradient of the palette will be applied for continuous variables.
Expl_RGBis a palette of 6 colours including blues, reds, green and yellow.Expl_RGB_darkis a palette of darker shades of the 6 colours withinExpl_RGB.Expl_Monois a palette of 6 colours ranging from a dark navy through grey to white.
Examples
library(ggplot2)
## generate a plot with the Exploristics theme
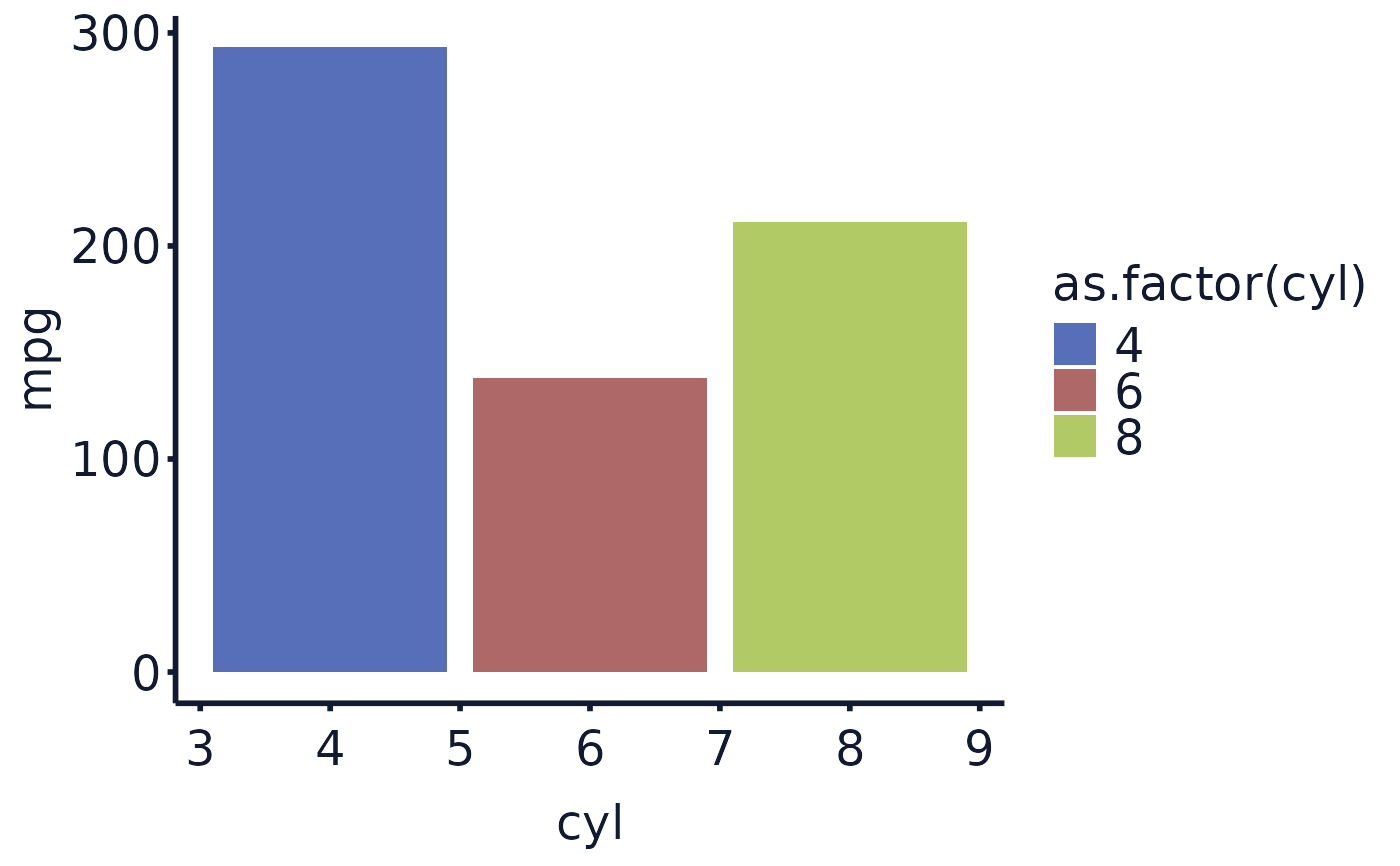
## if you want to use a numeric variable as discrete use `as.factor()` when setting `fill`
cars_plot <- ggplot(data = mtcars, aes(x = cyl, y = mpg, fill = as.factor(cyl))) +
geom_bar(stat="identity") +
exploristics_theme()
## adding the colour scheme can be written as one line
exploristics_fill(cars_plot, colour_pal="Expl_RGB_dark")
 library(magrittr)
## or using a pipe
cars_plot %>%
exploristics_fill(colour_pal="Expl_RGB_dark")
library(magrittr)
## or using a pipe
cars_plot %>%
exploristics_fill(colour_pal="Expl_RGB_dark")
 ## bar plots can appear to have "lines" within the bars if only setting colour
## if this happens set the colour to the same as the fill in the plot aes()
## and add exploristics_colour()
cars_plot <- ggplot(data = mtcars, aes(x = cyl, y = mpg, fill =
as.factor(cyl),colour=as.factor(cyl))) +
geom_bar(stat = "identity") +
exploristics_theme()
cars_plot %>%
exploristics_fill(colour_pal = "Expl_RGB_dark") %>%
exploristics_colour(colour_pal = "Expl_RGB_dark")
## bar plots can appear to have "lines" within the bars if only setting colour
## if this happens set the colour to the same as the fill in the plot aes()
## and add exploristics_colour()
cars_plot <- ggplot(data = mtcars, aes(x = cyl, y = mpg, fill =
as.factor(cyl),colour=as.factor(cyl))) +
geom_bar(stat = "identity") +
exploristics_theme()
cars_plot %>%
exploristics_fill(colour_pal = "Expl_RGB_dark") %>%
exploristics_colour(colour_pal = "Expl_RGB_dark")
